THE CRITERIA
It is hard to track epidemics. We have never had one in modern times. Are daily ups & downs or news updates the right way to track an epidemic? Most probably no. We need a more scientific approach. United States, the most affected country, came up with data driven conditions / gating criteria that each state should satisfy before proceeding to a phased opening.
https://www.whitehouse.gov/openingamerica/
Downward trajectory of documented cases within a 14-day period
OR
Downward trajectory of positive tests as a percent of total tests within a 14-day period (flat or increasing volume of tests)
To calculate movement or trajectory of positive cases, a rolling (or moving) average method is used. A 5-day moving average is the 5-day sum of new covid+ cases divided by 5. Moving averages are commonly used in technical analysis of stock prices. They help smooth out the price data by creating a constantly updated average price.
Based on the above criteria, we have developed 7 & 14 day trends of new covid+ cases for every state.
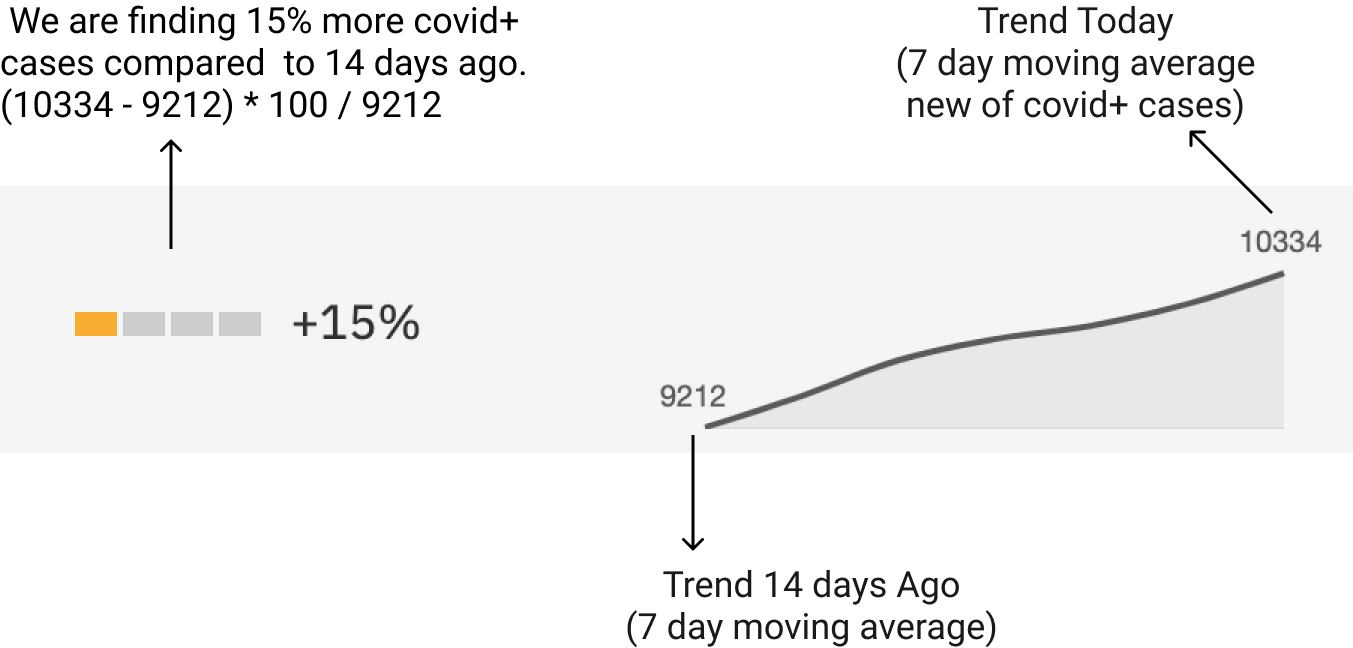
What is a 14 Day Trend of COVID+?
Growth of average daily covid+ cases in the last 14 days. How many more (or less) covid+ cases occurring today compared to 14 days ago.

This gives us the trajectory of covid+ cases in the last 14 days. Example below, 14 days ago there were an average 9212 covid+ cases daily. Today on average there are 10334 new covid+ cases daily. Today, on average we find 15% more covid+ cases.
Based on the trend value, every state is put in a simple red, orange, yellow, green scale.